Wednesday, April 30, 2008

LabVIEW SCREENS / WINDOWS

OPENING SCREEN :

LabVIEW opening screen

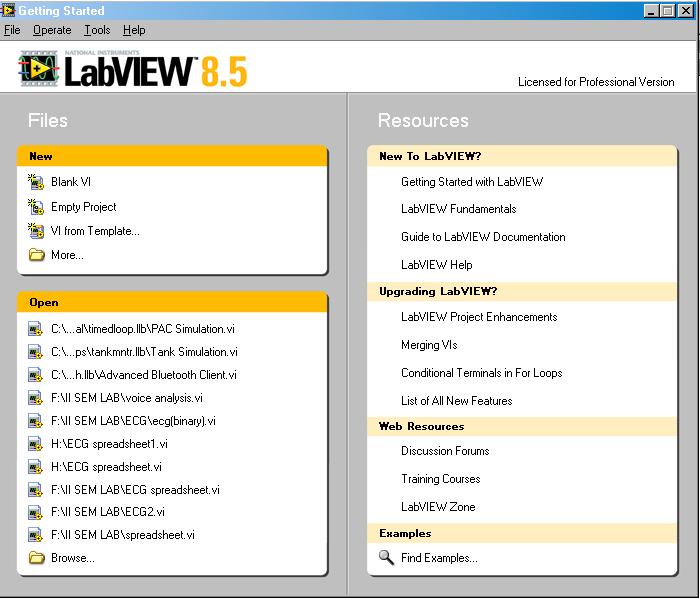
GETTING STARTED :

LABVIEW GETTING STARTED

EXAMPLE FINDER:

Find examples

Example finder

NI PXI-1042 CHASSIS


The National Instruments PXI-1042 chassis combines a high performance 8-slot backplane with high-output power supply, integrated cooling, and compact structural design providing a versatile platform for a wide range of measurement and automation applications. The NI PXI-1042, which incorporates all features of the latest PXI specification, provides an excellent platform for benchtop or rack-mounted test and control systems. With its modular compact design, the PXI-1042 also provides an excellent platform for portable test and data acquisition applications.

Tuesday, April 29, 2008

TERMINAL DATA TYPES IN LABVIEW

SIGNED INTEGERS


UNSIGNED INTEGERS


REAL FLOATING POINT


COMPLEX FLOATING POINT

Tuesday, April 22, 2008

RESPIRATORY SOUND ANALYSIS USING MICROPHONE

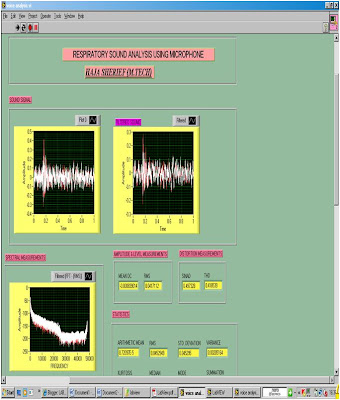
The following LabVIEW program will be helpful to analyse RESPIRATORY SOUND USING MICROPHONE.

FRONT PANEL OF PROGRAM

RESPIRATORY SOUND ANALYSIS USING MICROPHONE - FRONT PANEL

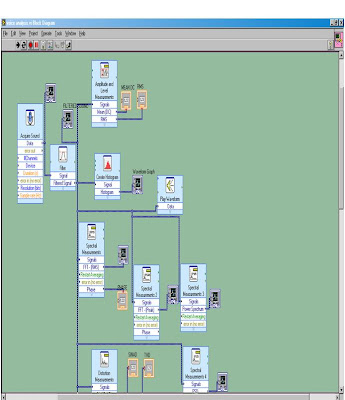
BLOCK DIAGRAM OF PROGRAM

RESPIRATORY SOUND ANALYSIS USING MICROPHONE - BLOCK DIAGRAM

SOUND RECORDING, PLAYING & PROCESSING USING LabVIEW

Recording Sound

In this experiment, we record sound in LabVIEW. In the next experiment, we play back thesounds we have recorded, and listen to the differences in the types of recordings.

1. On the Desktop double click on the LabVIEW Sounds folder. Double click on theRecord Sound icon. The front panel of the sound recorder opens up.

2. Print out the VI as described in the Printing VIs section above.

3. On the front panel, find the Sound Quality and Bits Per Sample. If you click on thelittle arrows next to it, you can change the Sound Quality between mono and stereo,and the Bits Per Sample between 8 and 16.

4. Select 8-bit mono.

5. Run the VI by clicking on the looped arrow button in the top left of the window. Thebutton changes appearance to indicate that the VI is running. The palette, the rowof icons on the top bar of the screen, also changes as the VI switches from the editmode to the run mode. Notice also that the stop button appears in the panelpalette.

6. We start recording. Make sure your microphone and speakers are turned on.

7. Click on the Record button, and start speaking into the microphone. Hold themicrophone close to your mouth to get the best recording. Notice your voice on thecorresponding graph (8-bit mono and stereo, 16-bit mono and stereo) as you arespeaking into the microphone.

8. Click the Stop button to stop recording. A window appears, asking for the name youwant to save the recorded wav file as. Save it in the LabVIEW Sounds folder as8bitMono. If you are not already in the LabVIEW Sounds folder, search for it on theDesktop.

9. Stop the VI by clicking on the red stop button next to the looped arrow used to startrunning the VI on the panel palette.

10. Follow the previous steps 3 through 9 to get recordings for 16-bit mono, 8-bit stereo,and 16-bit stereo. Make sure to select the appropriate Sound Quality (mono orstereo), and Bits Per Sample (8 or 16) before running the VI. Save theserecordings as 16bitMono, 8bitStereo, and 16bitStereo respectively.

11. Examine the block diagram of the VI by selecting Show Diagram from the Windowmenu. Observe the different objects in the diagram window. Each front panel hasan accompanying block diagram, which is the VI equivalent of a program. The block diagram is constructed using the graphical programming language G, as mentioned before. Notice how the components of the block diagram are wiredtogether to show the flow of data within the block diagram.

12. To change back to the front panel of the Record Sound VI, select Show Panel fromthe Window menu.

Playback Sound

In this experiment, we play back the sounds we have recorded, and listen to thedifferences in the types of recordings. In particular we look at the differences between the8 and 16-bit mono vs. the 8 and 16-bit stereo.

1. On the Desktop double click on the LabVIEW Sounds folder. Double click on thePlayback Sound icon. The front panel of the sound recorder opens up.2. Print out the VI as described in the Printing VIs section above.

3. Run the VI by clicking on the looped arrow button in the top left of the window.

4. Click on the File button. A window appears asking you to select a wav file to play.Select 8bitMono in the LabVIEW Sounds folder by double clicking on it. If you arenot already in the LabVIEW Sounds folder, search for it on the Desktop.

5. Click on the Play button. The wav file you have selected plays, and appears on thecorresponding graph. The text box above the Record, Play and Stop buttons alsoshows the channel (mono or stereo), the sampling rate, and the bits per sample (8or16) of the wav file being played.

6. Click the Stop button to stop playback.

7. Repeat steps 4 through 6 to listen to the other recordings (16bitMono, 8bitStereo,and 16bitStereo).

8. Stop the VI by clicking on the red stop button next to the looped arrow used to startrunning the VI on the panel palette.

9. Examine the block diagram of the VI by selecting Show Diagram from the Windowmenu. Observe the different objects in the diagram window.

10. To change back to the front panel of the Playback Sound VI, select Show Panelfrom the Window menu.

Filter Sound

In this experiment, we play back the sounds we have recorded, but send it through a filter,which alters the sound, and listen to the difference between the filtered and unfilteredsound.

1. Run the Playback Sound VI by clicking on the looped arrow button in the top left ofthe window.

2. Click on the File button as before, and select the 16bitMono wav file by doubleclicking on it.

3. By clicking on the Filter On/Off button you enable or disable the filter. Turn the filteroff, and click on the Play button. Click the Stop button to stop playback. Now turnthe filter on, and click on the Play button again. Notice the difference in sound.Also notice how the sound waveform changes on the far right graph.

4. By clicking on the Filter Type, you can change the type of filter used. These arecommon filters that are used in electrical engineering. We will not go into detailabout the different types of filters, as it is beyond the scope of this lab, but onlynotice how they change the sound.

5. Play around with the different filters, and see how they compare, and also how theycompare with the unfiltered sound (by enabling and/or disabling the filter). Makesure to click the Stop button before clicking on the Play button.

6. Also open some other wav files located in the LabVIEW Sounds folder and playaround with them, again making sure to click the Stop button before clicking on thePlay button. NOTE: only wav files with 16-bit mono sound formats can be filtered inthis experiment!

7. Stop the VI by clicking on the red stop button next to the looped arrow used to startrunning the VI on the panel palette.

8. Print out the VI as described in the Printing VIs section above.Close all VIs by selecting Close from the File menu of the front panel. Closing the VI fromthe diagram will close the diagram only, not the entire VI. Do not save any changes. Clickon “EXIT” in the LabVIEW window.

LabVIEW BASICS- FRONT PANEL & BLOCK DIAGRAM


Introduction


LabVIEW is short for Laboratory Virtual Instrument Engineering Workbench. It is a powerful software package for the programming and control of lab instruments, as well as a flexible instrumentation and analysis software system. Programs written in LabVIEW are known as virtual instruments (VIs). Virtual instruments have three main parts: a front panel, a block diagram, and an icon connector. The front panel is the interactive user interface of a VI, which resembles the front panel of an actual instrument. The front panel contains knobs, push buttons, graphs, and other controls (user inputs) and indicators (program outputs).

Each front panel is associated with a block diagram that can be thought of as the LabVIEW program. LabVIEW is similar to other software development systems with one significant difference. Other programming systems use text-based languages to create lines of code while LabVIEW uses a graphical programming language, called G, to create programs in block diagram form, eliminating syntactical details. In G, programs are formed by selecting blocks from available menus, setting their parameters, then connecting them or rewiring them.

FRONT PANEL OF LabVIEW PROGRAM

BLOCK DIAGRAM OF LabVIEW PROGRAM


ICON CONNECTOR

LabVIEW uses icons and graphical symbols rather than text to describe programming functions. LabVIEW has many libraries of functions and subroutines to accomplish almost any programming functions. It also has specific libraries for data acquisition, serial instrument control, data analysis, data presentation, and data storage. This includes functions for signal generation, signal processing, filters, windows, statistics, regression, linear algebra, and array arithmetic. Any computation possible in a conventional programming language is possible and usually simpler using the LabVIEW virtual instrument approach.

Panel Palette Descriptions
The palette is the row of icons on the top bar of the screen of a VI. We see these once we start running LabVIEW. The icons we use in this lab are:
1. Run Continuously Button (Looped Arrow) -Continuously runs the VI and allows for editing of controls while the VI is running.

2. Stop Button (Stop Signal) -Stops the VI from running.

Printing VIs
We will print out the VIs once we start with the experiments. This section might not make sense now, but it will when we start with the experiment. Refer back to this when you are asked to print out a VI.

1. Go to File>>Print on the front panel of the VI.

2. Highlight the VI name you want to print out from the Select VIs window. Click on "Next>".

3. Select "Using the panel" from the Print contents window. Click on "Print".

Sunday, April 20, 2008

ABBREVIATIONS IN TECHNOLOGY

1.) ADC - Analog to Digital Conversion

2.) ANSI - American National Standards Institute

3.) ASCII- American Standard Code for Information Interchange

4.) CSV - Comma Separated Value file

5.) CPU - Central Processing Unit

6.) DAC - Digital to Analog Converter

7.) DAQ - Data AcQuisition

8.) DC - Direct Current
AC - Alternating Current

9.) DLL - Dynamic Linked Library

10.) DMA - Direct Memory Access

11.) FFT - Fast Fourier Transform

12.) GOOP - Graphical Object-Oriented Programming

13.) GPIB - General Purpose Interface Bus

14.) HTML - Hyper Text Markup Language

15.) HTTP - HyperText Transfer Protocol

16.) IEEE - Institute of Electrical & Electronic Engineers

17.) LabVIEW - Laboratory Virtual Instrument Engineering WorkBench

18.) LED - Light Emitting Diode

ABBREVIATIONS IN DATA COMMUNICATION SYSTEM

1.) GPIB - General Purpose Interface Bus
HP-IB- Hewlett Packard Interface Bus
IEEE 488.2 BUS - Institute of Electrical & Electronic Engineers Standard 488.2

2.) IVI - Interchangeable Virtual Instruments

3.) LXI - LAN eXtensions for Instrumentation

4.) RS232- Recommended Standard Number 232

5.) SCPI - Standard Commands for Programmable Instrumentation

6.) USB - Universal Serial Bus

7.) VISA - Virtual Instrumentation Standard Architecture

TOOLKIT FOR REAL TIME & FPGA DEVELOPMENT

LabVIEW Toolkits for Real time & FPGA development are :

1.) Execution Trace Toolkit for LabVIEW Real Time

2.) LabVIEW FPGA Module

3.) LabVIEW Real Time Module

4.) PID Toolkit for Windows

CONCEPTS OF OBJECT ORIENTED PROGRAMMING

The various concepts for Object Oriented Programming in LabVIEW are :

1.) Class

2.) Object

3.) Encapsulation

4.) Inheritence

5.) Abstraction

6.) Polymorphism

TOOLKITS FOR CONTROL DESIGN & STIMULATION

LabVIEW Toolkits for Control Design & Stimulation are :

1.) Control Design Toolkit

2.) Control Design & Simulation Bundle

3.) LabVIEW Real Time Module

4.) LabVIEW Simulation Module

5.) Simulation Interface Toolkit

6.) State Diagram Toolkit

7.) System Identification Toolkit

TOOLKITS FOR AUTOMATED TESTING

LabVIEW toolkits for Automated Testing are :

1.) Database connectivity Toolkit

2.) IVI Driver Toolkit for Windows

3.) NI Analog Waveform Editor

4.) NI Digital Waveform Editor

5.) NI Teststand

6.) Switch Executive

TOOLKITS FOR EMBEDDED SYSTEMS DEVELOPMENT

LabVIEW toolkits for Embedded systems development are :

1.) Embedded Test Integration Toolkit

2.) Digital Filter Design Toolkit

3.) DSP Test Integration Toolkit

TOOLKITS FOR IMAGE PROCESSING & MACHIN VISION

LabVIEW toolkits for image processing & machine vision are"

1.) NI-IMAQ for IEEE 1394

2.) NI Vision Builder for Automated Inspection

3.) LabVIEW Vision Development module

4.) LabVIEW FPGA module

TOOLKITS FOR SIGNAL PROCESSING & ANALYSIS

LabVIEW toolkits for signal processing & analysis are :

1.) Sound & Vibration Toolkit

2.) Advanced Signal processing Toolkit

3.) Modulation Toolkit

4.) Digital Filter Design Toolkit

5.) Math Interface Toolit

6.) Order Analysis Toolkit

7.) Spectral Measurements Toolkit

Saturday, April 19, 2008

DATA ACQUISITION HARDWARES - ANALOG CHANNELS

1.) NI-9229 (4-Channel, 24-Bit Analog Input Module)

Friday, April 18, 2008

COMMUNICATION CABLES/CONVERTERS

1.)RS-232 CABLE

9 PIN MALE- 9 PIN MALE CONNECTION :


9 PIN MALE- 9 PIN FEMALE CONNECTION :


2.) USB TO RS232 (9 PIN) CABLE


USB CABLE - PLUG A TO PLUG B

RS-232 EXTENSION CABLES


(RS232 Cable : 9-pin male on one end, 9-pin female on the other end)


RS-232 (also referred to as RS-232C) is a standard for asynchronous serial data communication between a DTE (Data terminal equipment) and a DCE (Data communication equipment), commonly used in personal computer serial ports. This originally meant a dumb terminal (or teletypewriter) and a modem; it was only later that minicomputers, personal computers, printers, and other devices started to make use of the standard. For many years some form of RS-232 port was a standard feature of almost all computers (other than IBM mainframes) and remained in widespread use into the late 1990s. For much of this time it was the standard way to connect modems.


Today RS-232 is gradually being superseded by USB, which is faster and has connectors that are simpler to connect and use. This is why many PCs intended for office use often ship with "legacy-free" motherboards without any RS-232 circuitry. However, RS-232 is still quite common in point-of-sale (cash drawers, barcode and magnetic stripe readers) and industrial (measurement and remote-control devices) peripherals, so computers made for such applications are still equipped with RS-232 ports either "on-board", or on a separate PCI or ISA card.

In RS-232, characters are sent one by one as a pattern of bits. The most common encoding format is the asynchronous start-stop format which uses a "start bit" followed by seven or eight data bits, possibly a "parity" bit, and one or two "stop bits". Thus 10 bits are used to send a single character, which has the nice side effect that dividing the signalling rate by ten results in the overall transmission speed. The most common alternative to asynchronous start-stop is HDLC.

The RS-232 standard defines the voltage levels that correspond to logical one and logical zero levels, the standard transmission speeds and connector types.

The standard specifies 25 different signal connections, and a 25-pin "D-sub" (D-shaped subminiature) connector was commonly used. Male and female connectors are used – often cable ends are male and device connectors are female; but not always; m-m and f-f "gender changers" are available. For configuring and diagnosing problems with RS-232 cables, a "breakout box" may be used. This device normally has a female and male RS-232 connector and is meant to attach in-line; it then has lights for each pin.


(RS232 Cable : 25 pin male-male connection)

Most of these pins were unused by many devices, however, so it was common for machines to save money by using smaller connectors. The IBM PC was released with 9-pin D-sub connectors, and that became the de facto standard; most external devices still use 25-pin connectors, so cables with 9 pins on one end and 25 on the other were common. The Apple Macintosh used a similar system, but later changed to a new connector with only 8 pins, less than what is needed for a modem.

RS-232 cables may be built with connectors commonly available at electronics stores. The cables may be between 3 and 25 pins; typically 4- or 6-pin wires are used. Flat RJ (phone-style) cables may be used with special RJ-RS232 connectors, which are the easiest to configure (since the wires are parallel and not twisted, the cables may not be able to support a signal over longer distances).

Signals are plus or minus 3 to 15 volts. Zero volts is not a valid RS-232 level; logic zero is defined as a negative voltage equal to logic one. Signal levels of +-5, +-10, +-12, and +-15 are all commonly seen depending on the power supplies available within a device.

There are three types of signals carried by these wires: ground, transmit/receive, and handshake. There are standard codes for these signals, for example:

SG or GND - Ground
TD or TX - Transmit Data
RD or RX - Receive Data
DTR - Data Terminal Ready
DSR - Data Set Ready
RTS - Ready to Send
CTS - Clear to send
DCD - Data Carrier Detect
RI - Ring Indicator
FG - Frame Ground


RS-232 devices may be classified as DTE (Data Terminal Equipment) or DCE (Data Communications Equipment) – this defines which wires will be sending and receiving each signal. However, these definitions are not always adhered to strictly; normally it's necessary to consult documentation or test connections with a breakout box to determine signals required.

The ground signal is meant to ground the other connections. It is reqired. However, if the equipment is far enough apart or on separate power systems, the ground will degrade between the two devices and communications will fail; this is a difficult condition to trace. For 25-pin connectors, pin 7 is normally ground (pin 1, chassis ground, is rarely used).


(RS232 Cable : 25 pin configuration)

For 25-pin connectors, pin 2 and 3 are the normal transmit/receive pins. One device will be sending on 2 and receiving on 3; the other should be the reverse (if not, the reverse is done in the cable end as with a null modem adapter). If you're wiring a connection, check with the breakout box on each device to see which pin it's transmitting on. Strictly speaking, only one device need be transmitting (if no handshakes or duplex communication is required)--for example a simple printer that does not report status back to the computer. But normally both TX and RX are required.

Other "handshakes" may be required by one or the other device. For example, pin 20 is commonly used to indicate "device ready". Pins may also be "jumpered" or routed back within the connector. For example a pin saying "are you ready?" from device A might be wired to the pin saying "I'm ready" on device A if device B did not transmit such a signal. Common handshake pins are 20, 8, 4, and 6.

Software-wise there are a multitude of settings for serial connections. Most common settings are speed, parity, and stop bits.

Speed is bit speed from one device to another in bits per second (bit/s). Common bit rates per second are 300, 1200, 2400, 9600, 19200, etc. Typically both devices must be set to the same speed but some devices (such as modems) may be set to autodetect speed.

Parity is a method of verifying accuracy of data. Parity is usually either none (not used), odd, or even (other parity systems such as "mark" or "space" are much less common). Parity works by modifying the data in each byte sent (or restricting the bytes sent if you like). Parity none is simple, the data is not changed. In even parity the data is arranged so that the number of 1 bits (that is, the total count of them in a binary byte) is an even number; this is arranged by setting the parity bit (usually the most significant bit) to be a 0 or 1 accordingly. In odd parity the number of 1 bits is an odd number. Parity can be used by the receiver to detect transmission errors - if a byte is received with the wrong number of 1 bits, then it must have been corrupted.

Stop bits are sent at the end of every byte transmitted in order to help the signal hardware at either end of the link resynchronise.

There is a D/P/S conventional notation for specifying the software setup of a serial connection. 8/N/1 (very common) specifies 8 data bits, no parity, 1 stop bit. The number of data bits can be 7, 8, or (sometimes) 9. Parity can be none (N), odd (O), or even (E); the parity bit is borrowed from the data bits, so 8/E/1 means that one of the 8 data bits is used as the parity bit. There can be 1, 1.5, or 2 stop bits.

Other settings define when pins will send handshake signals, or other data integrity checks. The most common of these is XON/XOFF. The XON character tells the receiver that the sender is ready to receive more data. The XOFF character tells the receiver to stop sending characters. The use of XON/XOFF is deprecated, it is preferable to use RTS/CTS flow control instead.

There are a couple signaling "standards" often called RS-232, but really aren't. TTL-level RS-232 uses +5V for high, and 0V for low. CMOS-level RS-232 uses +3.3V for high, and 0V for low. Typically, these signal levels are used between two devices on the same circuit board. 20mA current loop uses the absence of 20mA current for high, and the presence of current in the loop for low; this signal level is often used for long-distance and optically isolated links.
Synonyms of RS-232 are: EIA-232, V.24

Other interfaces similar to RS-232:

1.)RS-422 (a high-speed system similar to RS-232 but with differential signalling)


2.)RS-485 (a descendant of RS-422 that can be used as a bus in multidrop configurations)
Thursday, April 17, 2008

STEPPER MOTOR CONTROL USING LabVIEW


The above video shows a simple trial to drive a stepper motor (6 inputs where 2 are common) using ULN2803 and LabVIEW with Digital I/O for Motion Controller PXI 7358.

With the GUI, we can specify the speed and the step we want.

GPS TOOLKIT


Sensitivity is one of the most important characteristics of a GPS receiver. In this video, learn how to measure a receiver's sensitivity using the NI GPS Toolkit for LabVIEW and a PXI vector signal generator.

LabVIEW BASICS FOR APPLICATIONS DEVELOPMENT


This is a video we made to help introduce people to some of the concepts in LabVIEW. LabVIEW is a programming language that was created in 1986 and has become very popular among engineers and scientists because it is almost entirely graphical. Graphical programming languages like LabVIEW are really great for people that don't like or don't understand text based languages like C++ or C#. You can do all of the things that a text based language can do but you don't have to worry about things like thread management or memory allocation. You can even create fairly powerful applications for multicore processors that truly take advantage of the different cores.
This video just introduces the basics of LabVIEW but if you want, you can actually go check out the Evaluation version at

http://www.ni.com/labview/

LabVIEW DIGITAL FILTER DESIGN


This brief demo shows how to use graphical programming in National Instruments LabVIEW to design a digital filter and export the design as a text file. Tools from the Digital Filter Design Toolkit for LabVIEW are used to specify and implement the design.

START WITH LabVIEW BASICS


This video shows you how to get started with LabVIEW. It teaches you how to use the LabVIEW environment and helps your create your first simple VI.

LabVIEW ROBOT CONTROL


National Instruments continuously works closely with Lego to expand virtual instrumentation into the classroom by developing LabVIEW integration with their Mindstorms NXT platform. In this latest VI Shots video we see a demo of an NI product acquired from Hyperception, the Speedy-33. We see how the Speedy-33 combined with a HiTechnic interface can integrate LabVIEW signal processing algorithms to move an NXT based on audio frequencies.

BCI WHEELCHAIR MOVEMENT USING LABVIEW


A group of engineering students at the University of Illinois have developed an amazing technology that interperets the brain's speech signals using National Instrument's products. They used this technology to create a wheelchair that is controlled only by your thoughts.

NI SPEEDY-33 DSP BOARD - PARTS


The NI SPEEDY-33 (Signal Processing Engineering Educational Device
for Youth featuring the Texas Instruments VC33 DSP) is a self-contained,
high-performance, programmable product for signal processing
applications. It boasts an easy-to-use, fast Digital Signal Processor (DSP)
along with a number of features important to many signal processing
applications. The NI SPEEDY-33 onboard flash memory, together with an
easy-to-learn, easy-to-use software programming tool, supports the quick
creation of standalone DSP-based products.


NI SPEEDY-33 is a low-cost, high-performance floating-point
TMS320VC33-based DSP system connected to a standard PC through the
USB port. This easy-to-use system supports a variety of DSP processing,
including audio applications with two input/output analog channels
sampled at 48 kHz, and other applications with onboard digital I/O for
controlling motors/servos. The NI SPEEDY-33 features 34 K × 32 words
of on-chip memory. The 512 K × 8 onboard flash memory allows for
storage of both the program application (programmed with the LabVIEW
DSP Module or VAB software), as well as data such as tables, sound
waveforms, and so on.

The NI SPEEDY-33 has eight lines of digital I/O, arranged as an eight-bit
switch input port, and eight digital output LEDs. The digital I/O lines can
be programmed with the LabVIEW DSP Module or VAB software. The
eight inputs and eight outputs are also accessible through the simple
expansion digital I/O connector. After the flash memory is programmed,
the NI SPEEDY-33 can be unplugged from the PC and run in standalone
mode.

Wednesday, April 16, 2008

LabVIEW

LabVIEW (short for Laboratory Virtual Instrumentation Engineering Workbench) is a platform and development environment for a visual programming language from National Instruments. The graphical language is named "G". Originally released for the Apple Macintosh in 1986, LabVIEW is commonly used for data acquisition, instrument control, and industrial automation on a variety of platforms including Microsoft Windows, various flavors of UNIX, Linux, and Mac OS. The latest version of LabVIEW is version 8.5.1, released in April of 2008.

DATAFLOW PROGRAMMING

The programming language used in LabVIEW, called G, is a dataflow programming language. Execution is determined by the structure of a graphical block diagram (the LV-source code) on which the programmer connects different function-nodes by drawing wires. These wires propagate variables and any node can execute as soon as all its input data become available. Since this might be the case for multiple nodes simultaneously, G is inherently capable of parallel execution. Multi-processing and multi-threading hardware is automatically exploited by the built-in scheduler, which multiplexes multiple OS threads over the nodes ready for execution.

Programmers with a background in conventional programming often show a certain reluctance to adopt the LabVIEW dataflow scheme, claiming that LabVIEW is prone to race conditions. In reality, this stems from a misunderstanding of the data-flow paradigm. The aforementioned data-flow (which can be forced, typically by linking inputs and outputs of nodes) completely defines the execution sequence, and that can be fully controlled by the programmer. Thus, the execution sequence of the LabVIEW graphical syntax is as well-defined as with any textually coded language such as C, Visual BASIC, Python etc.[citation needed] Furthermore, LabVIEW does not require type definition of the variables; the wire type is defined by the data-supplying node. LabVIEW supports polymorphism in that wires automatically adjust to various types of data.

GRAPHICAL PROGRAMMING

LabVIEW ties the creation of user interfaces (called front panels) into the development cycle. LabVIEW programs/subroutines are called virtual instruments (VIs). Each VI has three components: a block diagram, a front panel and a connector pane. The latter may represent the VI as a subVI in block diagrams of calling VIs. Controls and indicators on the front panel allow an operator to input data into or extract data from a running virtual instrument. However, the front panel can also serve as a programmatic interface. Thus a virtual instrument can either be run as a program, with the front panel serving as a user interface, or, when dropped as a node onto the block diagram, the front panel defines the inputs and outputs for the given node through the connector pane. This implies each VI can be easily tested before being embedded as a subroutine into a larger program.

The graphical approach also allows non-programmers to build programs by simply dragging and dropping virtual representations of the lab equipment with which they are already familiar. The LabVIEW programming environment, with the included examples and the documentation, makes it simpler to create small applications. This is a benefit on one side but there is also a certain danger of underestimating the expertise needed for good quality "G" programming. For complex algorithms or large-scale code it is important that the programmer possess an extensive knowledge of the special LabVIEW syntax and the topology of its memory management. The most advanced LabVIEW development systems offer the possibility of building stand-alone applications. Furthermore, it is possible to create distributed applications which communicate by a client/server scheme, and thus is easier to implement due to the inherently parallel nature of G-code.

To maintain clean and legible user VI interfaces its best to keep these tips in mind: Keep panels simple and clean, keep a consistent style, clean up wires where ever possible, use proper terminology when labeling controls and indicators.